I have explained elsewhere that Indian companies were financially strong to face the Global Liquidity Crisis (GLC) that erupted in late September 2008. (See ?Banks, have no fear? and ?India Inc is not dry? in the FE of November 3 and December 18, 2008, respectively.) Conditions had turned adverse for Indian companies early in 2008. Interest rates were raised at regular intervals, wages had been rising for a few years and the cost of energy and raw material inputs had risen steeply. The GLC hit the corporate sector when it was already well into battling these adverse conditions. It was the robust growth in profits of the preceding three years that helped the corporates cope with the initial adverse conditions and then the GLC.
Before this, the last time the corporate sector saw a runaway growth being arrested was in 1997. That was caused partly by the Asian Contagion and largely by RBI?s drastic domestic liquidity squeeze then. Prima facie, the GLC-induced slow down is much more severe because of India?s greater integration with the USA (where the crisis has struck most this time), than with the East Asian economies and because the breakdown of international finance has been far more reverberating this time.

In spite of the greater severity of the crisis this time than in 1997, Indian corporates are likely to survive this one more better than they were equipped to handle the one in 1997. Why should this be so? What makes the Indian corporate sector so much more resilient this time than it was earlier? Or, why should we not again see a prolonged period of decline in growth as we had seen between 1997 and 2004? I seek to answer this question with the help of some slicing of the financial performance database of over 5,000 companies over the period 1991 through 2008. This period covers sufficient observations on the build up to both the crisis points?in 1997 and in 2008.
CMIE?s Prowess database provides a panel of over 17,000 companies. For the purpose of our analysis, we exclude the financial services companies?these are banks and NBFCs. This leaves us with about 14,000 non-financial services companies. Several companies exit the panel because they cease to exist or because they merge with other companies. Correspondingly, many companies enter the panel as new companies are formed. On a net basis, the annual panel has been increasing over time. After 1993-94, on an average, there are a little more than 5,000 non-finance companies in a year
This dataset shows that as of March 2008, the profit margins of the companies was the highest, the debt: equity ratio was the lowest, the working capital cycle the lowest and the debtor days were the lowest since 1990. India Inc was thus at it?s best compared to any year in the past 18 years. In March 2008, it was much stronger than it was in March 1997. However, beyond these aggregate values for the corporate sector as a whole, it is the distribution of this financial prowess across size groups of companies that provides greater comfort regarding India Inc?s strength.
CMIE classifies companies into ten size groups based on an average of the company?s sales and assets. Each decile in this data set has roughly an equal number of companies. Thus, the top decile contains the largest one-tenth of the companies and the lowest decile contains the smallest one-tenth of the companies in the set. An analysis of the financial ratios for these size groupings of companies provides evidence that India Inc is stronger this time than in the past.
We study the period 1992-93 through 2007-08. Thus the study begins just after liberalisation and spans over a period of 16 years as estimates of both the beginning and end years are included in the study. We divide the period into three parts. The first spans the growth period immediately after liberalisation?1992-93 through 1996-97, the second is the period of slowdown?1997-98 through 2002-03, and the last is a period of growth again between 2003-04 and 2007-08.
During the mid-1990s, sales of non-finance companies grew at 16.1 per cent per annum. This growth rate fell by almost half to 8.6 per cent annum during the slowdown period. The recent-growth period?between 2003-04 and 2007-08?has seen a much higher pace of sales increase of 18.4 per cent per annum. Average inflation during the mid-1990s period was much higher at 8.3 per cent per annum compared to the 5.4 per cent average inflation during the mid-2000s. Thus, in real terms, the growth in sales was significantly higher in the mid-2000s than it was in the mid-1990s.
An important difference in the growth rates of the mid-1990s and the recent growth period is its distribution amongst size groups. During the mid-1990s the growth was concentrated mostly in the smaller companies. Compared to the average growth of 16.1 per cent during this period, the smallest three decile companies grew at over-24 per cent per annum while the top three decile companies grew at under-18 per cent per annum. The growth rates dropped steadily as the size group dropped. This was then hailed as the successful outcome of liberalisation. Small and young companies were nimble enough to grow rapidly in the new environment compared to slumbering giants of the control-era.
However, these small companies were still running losses on a net basis. They booked losses of 8.1 per cent on sales in the year ended March 2007. These losses and their wafer-thin PBDITA margins made them incapable of dealing with the impending and prolonged slowdown that began in the late 1990s.
The slumbering giants around this time were still coping with the consequences of liberalisation. Their net profit margins were just about enough to survive the downturn. The top three deciles had a net profit margin of 2.3 per cent. The top-decile companies had a relatively healthy net profit margin of four per cent. Around March 2007, sales growth was inversely proportional to size while profits were directly proportional to size. The large companies were ill-prepared for the downturn because of their re-structuring following liberalisation and the small companies were growing rapidly but were still financially too weak to face the downturn. As a result, the corporate sector as a whole suffered badly in the period of the slowdown between 1997 and 2003.
Now compare this scenario of around March 1997 with that in March 2008. The large business houses have re-organised themselves financially and organisationally. Unrelated businesses of the slumbering giants of the 1990s have been hived off and their competencies have been put to test globally. Growth around March 2008 is large-companies centred.
During the five years between 2003-04 and 2007-08, India Inc?s sales grew at the rate of 18.4 per cent per annum. The top three deciles had a growth of nearly 19 per cent per annum during this period. In contrast, the bottom three deciles had a growth of less than ten per cent per annum. The middle four deciles had a growth in between?of 14 per cent. Thus, in contrast with the situation in the mid-1990s when growth was inversely proportional to size, in the mid-2000s, growth in business has been directly proportional to size.
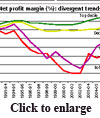
The difference in net profit margins between the two periods is much sharper. Firstly, net profit margins have increased from an average of 3.9 per cent in the mid-1990s to 7.1 per cent in the mid-2000s. In 2007-08 this shot up to an all-time high of 11.5 per cent. At this level, the net profit margin was more than thrice the margin in 1996-97, which was 3.2 per cent. These high profit margins in the mid-2000s are a source of tremendous financial strength for the companies. In 2007-08, while the top three deciles in terms of size generated net profits of 7.3 per cent of sales, the bottom three deciles made losses of 5.4 per cent of their sales. Large companies have a low gearing of only 0.7 times compared to the 1.5 times gearing of the smaller companies.
The higher growth in real sales and the much higher net profit margins during the mid-2000s fueled the growth in investments during the same period. However, this growth has been a lot more cautious this time compared to the exuberance of the mid-1990s. Growth in gross fixed assets per annum was 16.4 per cent in the mid-1990s. This growth rate fell to 8.1 per cent in the period of the slowdown. In the recent period of growth, it has picked up again but to a lower rate of 12.8 per cent in the mid-2000s. And, once again differentiating from the mid-1990s, the growth in the mid-2000s is concentrated in the larger companies. It was 13.9 per cent in the top three decile companies and was a mere 2.1 per cent in the bottom three decile companies.
During the mid-2000s, India Inc experienced greater competition than it did in the mid-1990s. Competition from overseas has increased as import duties have declined persistently. Domestic competition has also increased as the number of producers has increased. Larger companies have been in a better position to deal with this competition than the smaller ones. A more active mergers and acquisitions environment has provided an exit route to those smaller companies that found the competition difficult to deal with. As a result, larger companies have grown both organically and inorganically.
This superior financial performance and strength of the larger companies, their consolidation and their exposure to globalisation during the recent boom times provides the confidence that India Inc is far more resilient today to face the difficult environment than it was capable of handling the crisis during the mid 1990s.
?The author heads the Centre for Monitoring Indian Economy


